Automating Diagram Creation with Mermaid CLI and AI Tools
Making diagrams has always been one of my least favorite parts of documentation. I'd waste hours moving boxes around and still end up with something that looked amateur. That changed when I discovered Mermaid. In this post, I'm sharing how I use Mermaid CLI to create diagrams using just text, and how artificial intelligence tools have completely transformed and streamlined this process.
What is Mermaid?
Mermaid is a free, open source tool that turns text into diagrams, kind of like how Markdown turns text into formatted content. It's completely free under the MIT license, so you can use it for work or personal stuff without worrying about licensing costs. It can be used to make all kinds of diagrams, like:
- Flowcharts
- Sequence diagrams
- Class diagrams
- Entity-relationship diagrams
- Gantt charts
- Pie charts
- User journey maps
- Git graphs
- State diagrams
- And many more
What I love most is how I never have to drag boxes around anymore. I just write text, and Mermaid creates the diagram. After years of fighting with traditional diagram tools, this approach feels like a revelation.
Getting Started with Mermaid CLI
I started using Mermaid in the browser, but the CLI (Command Line Interface) version is where the real magic happens. It lets you turn your text diagrams into actual image files that you can put in docs, presentations, or wherever. And it's super easy to use.
The basic syntax for using Mermaid CLI is:
npx @mermaid-js/mermaid-cli -i diagram.mmd -o diagram.pngThis command:
npx @mermaid-js/mermaid-cli: Runs the Mermaid CLI tool without requiring a global installation-i diagram.mmd: Specifies the input file containing your Mermaid diagram definition-o diagram.png: Sets the output file name and format (PNG in this case)
You can also generate SVG files which are scalable and perfect for web use:
npx @mermaid-js/mermaid-cli -i diagram.mmd -o diagram.svgYou can also quickly preview your Mermaid code online using tools like MermaidChart, which is great for testing and sharing diagrams without installing anything.
Creating Your First Mermaid Diagram
Let's start with a simple flowchart. Create a file named flowchart.mmd with this content:
flowchart TD
A[Start] --> B{Decision}
B -->|Yes| C[Process 1]
B -->|No| D[Process 2]
C --> E[End]
D --> E
Now, generate a PNG image of this diagram:
npx @mermaid-js/mermaid-cli -i flowchart.mmd -o flowchart.pngThis will create a clean, professional-looking flowchart showing a simple decision process, like this:
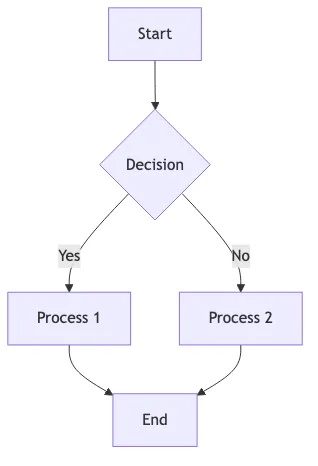
You can use this same approach for any type of diagram that Mermaid supports.
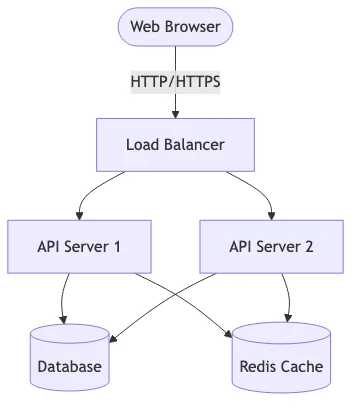
For example, if you need to visualize a system architecture (as I recently did), you might create something like this:
flowchart TD
Client([Web Browser]) --HTTP/HTTPS--> LB[Load Balancer]
LB --> API1[API Server 1]
LB --> API2[API Server 2]
API1 --> DB[(Database)]
API2 --> DB
API1 --> Cache[(Redis Cache)]
API2 --> Cache
Which produces this diagram:
How AI Supercharges Diagram Creation
This is where artificial intelligence becomes a game-changer. Instead of manually writing Mermaid diagrams, AI tools like Cursor and Windsurf can analyze text descriptions and automatically generate diagram definitions for you.
I recently had to create an architecture diagram for an AWS + Drupal project with a complex architecture. Without AI, this would have taken significant time to map out all the components and connections. Instead, I fed the project specifications to Cursor's AI assistant, asked it to extract the system components and their relationships, and got Mermaid code that helped me create the diagram more efficiently.
Using Cursor's AI to Generate Diagrams
Cursor is an IDE with powerful AI that understands both code and natural language. Its ability to interpret technical descriptions and convert them into structured Mermaid syntax is remarkable. Here's my typical workflow:
- Copy relevant text that describes the concept you want to visualize
- Use a prompt like: "Generate a Mermaid diagram based on this description"
- Cursor will analyze the text and generate appropriate Mermaid syntax
- Save the generated Mermaid code into a .mmd file
- Use Mermaid CLI to convert it to an image
For example, you could prompt Cursor with instructions like:
- "Create a Mermaid flowchart showing a user registration process"
- "Generate a Mermaid sequence diagram for this API request flow"
- "Convert this project timeline into a Mermaid Gantt chart"
- "Create a Mermaid class diagram from this domain model description"
Within seconds, you'll have a complete Mermaid diagram that accurately represents your concept.
Taking It Further with Windsurf's AI
Windsurf (from Codeium) leverages AI to take diagram automation even further. Its AI models can analyze entire codebases or documentation sets to create scripts that:
- Scan text files for descriptions that could be visualized
- Extract key elements and relationships
- Generate appropriate Mermaid syntax based on content type
- Automatically run the Mermaid CLI to create diagram images
- Include these diagrams in your documents
This creates a continuous documentation workflow where your diagrams stay in sync with your written content. The AI can detect when your code or documentation changes significantly enough to warrant diagram updates, making the entire process nearly hands-free.
Advanced Diagram Types
Mermaid supports many diagram types beyond simple flowcharts. Here are some useful ones for architecture documentation:
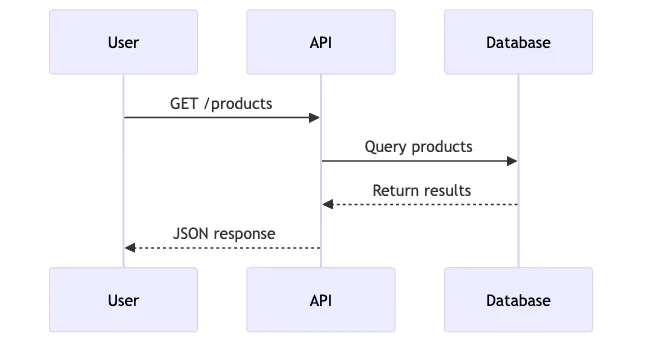
Sequence Diagrams
Perfect for illustrating how components interact over time:
sequenceDiagram
participant User
participant API
participant Database

User->>API: GET /products
API->>Database: Query products
Database-->>API: Return results
API-->>User: JSON response
Which produces this sequence diagram:
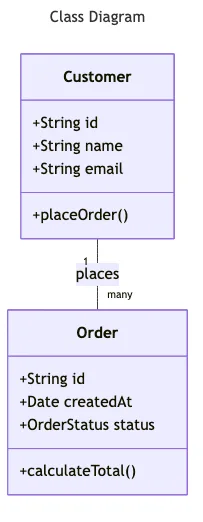
Class Diagrams
Ideal for showing object-oriented design:
classDiagram
class Order {
    +String id
    +Date createdAt
    +OrderStatus status
    +calculateTotal()
}
class Customer {
    +String id
    +String name
    +String email
    +placeOrder()
}
Customer "1" -- "many" Order: places
Which produces this class diagram:
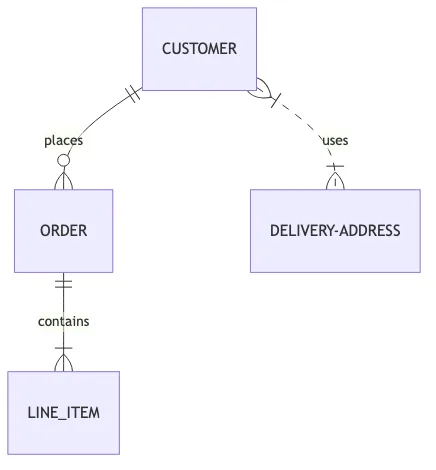
Entity Relationship Diagrams
Great for database design:
erDiagram
CUSTOMER ||--o{ ORDER : places
ORDER ||--|{ LINE_ITEM : contains
CUSTOMER }|..|{ DELIVERY_ADDRESS : uses
Which produces this entity relationship diagram:
Practical Examples
Mermaid CLI can be used for various visualization needs, including system architecture documentation (as mentioned earlier), but also for:
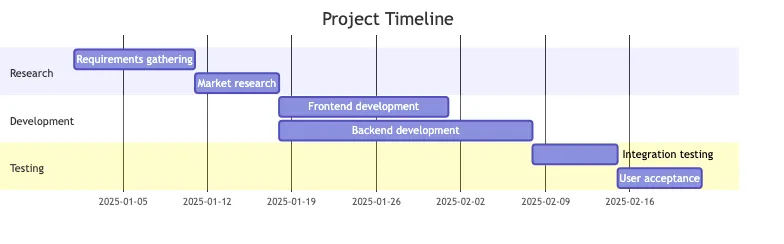
Project Planning
For project planning, you can create a Gantt chart showing phases and dependencies:
gantt
title Project Timeline
dateFormat  YYYY-MM-DD
section Research
Requirements gathering :a1, 2025-01-01, 10d
Market research       :after a1, 7d
section Development
Frontend development  :b1, 2025-01-18, 14d
Backend development   :b2, 2025-01-18, 21d
section Testing
Integration testing   :c1, after b1 b2, 7d
User acceptance       :c2, after c1, 7d
Which produces this timeline visualization:
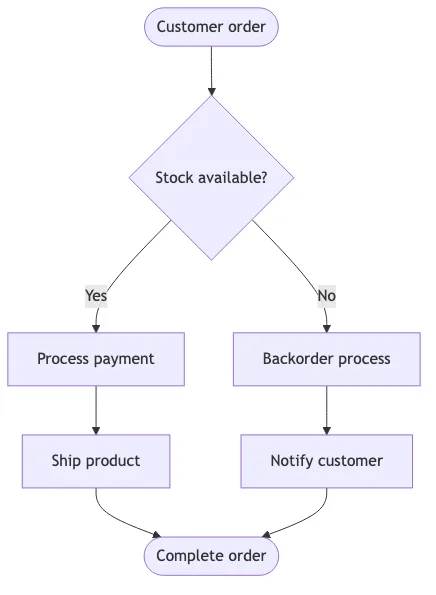
Process Documentation
For documenting business processes, Mermaid can create clear flowcharts:
flowchart TD
Start([Customer order]) --> A{Stock available?}
A -->|Yes| B[Process payment]
A -->|No| C[Backorder process]
B --> D[Ship product]
C --> E[Notify customer]
D & E --> End([Complete order])
Which produces this process flowchart:
Future Possibilities with AI and Automation
The combination of Mermaid CLI and AI tools opens up exciting possibilities for documentation automation. I envision a system that could:
- Monitor documentation files for changes
- Use AI to identify content that could benefit from visualization
- Generate appropriate Mermaid syntax based on the content
- Automatically run Mermaid CLI to create fresh diagram images
- Intelligently embed the diagrams in documentation with proper context
Such a setup would keep diagrams in sync with documentation without manual intervention. While I haven't built this system yet, the current AI tools and Mermaid CLI make it entirely possible.
Tips for Better Diagrams
- Use meaningful shapes: Mermaid offers various node shapes to distinguish different types of components (databases, services, external systems)
- Add color for clarity: Use colors to group related components or highlight important elements
- Keep it simple: Avoid overcrowding diagrams; create multiple focused diagrams instead of one complex one
- Use subgraphs: Group related components together using subgraphs to show logical boundaries
- Add titles and descriptions: Make your diagrams self-explanatory with clear titles and brief descriptions
In Summary
Mermaid offers a practical approach to diagram creation that integrates well with development workflows. The text-based nature of Mermaid diagrams makes them version-control friendly and easier to maintain than traditional diagram formats.
When combined with AI tools, the process becomes even more efficient. These tools can help generate diagram code from descriptions, making it accessible even to those without deep technical knowledge.
Here are some final thoughts about using Mermaid:
- Learning curve: The syntax is relatively simple to learn, especially if you're already familiar with markdown or other text-based formats.
- Integration: Mermaid diagrams work in many platforms including GitHub, Notion, and other documentation systems.
- Cost: As an open-source tool with an MIT license, Mermaid is free to use for any purpose.
- Efficiency: Text-based diagram creation can be faster than traditional diagramming once you're familiar with the syntax.
- Ease of setup: Using npx to run Mermaid CLI eliminates installation headaches.
If you're looking to improve your documentation process, consider giving Mermaid a try for your next project. The ability to create professional diagrams directly from text descriptions, with the potential assistance of AI tools, might just transform how you approach visualization in your work.