How to Debug Safari Issues on iOS Using Xcode
2023-09-14•3 min read
Ever tried opening a website on an iPhone and noticed it looks or behaves differently? This can happen because of the way Safari on iPhones (or iOS) works. If you’re making websites or web apps, you’ll want them to work perfectly on iPhones too. This guide will show you how to spot and fix these issues using a tool called Xcode.
1. Essential Tools to Debug Safari Issues on iOS Using Xcode:
- Xcode: Ensure you have the latest version installed. It’s available on the Mac App Store.
- iOS Device or Simulator: You can either use an actual device or the built-in simulator that comes with Xcode.
- Developer Account: If using a physical device, ensure it’s registered on your Apple Developer account.
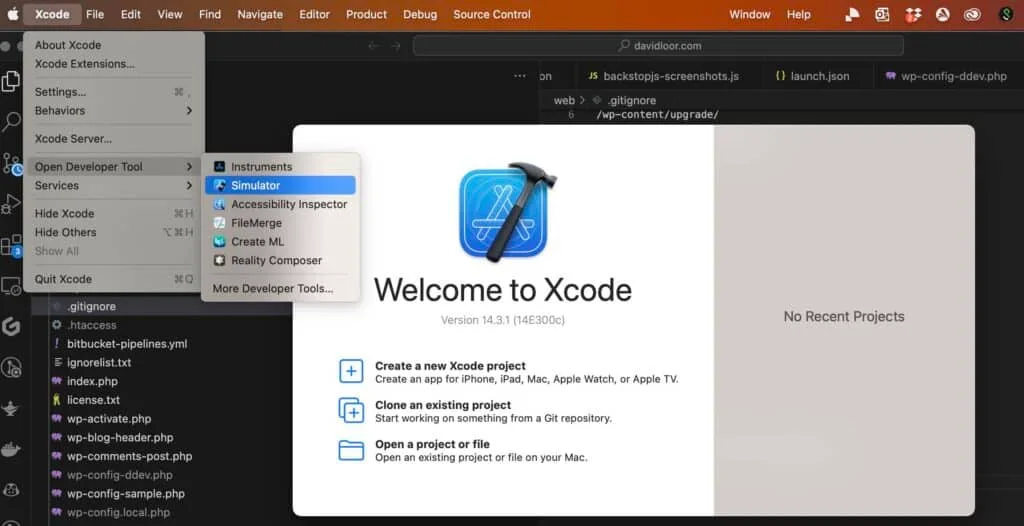
2. Setting up the Simulator:
- Launch Xcode and initiate the iOS Simulator of your choice.
- Once running, navigate to the Safari app, similar to how you’d do on a physical device.
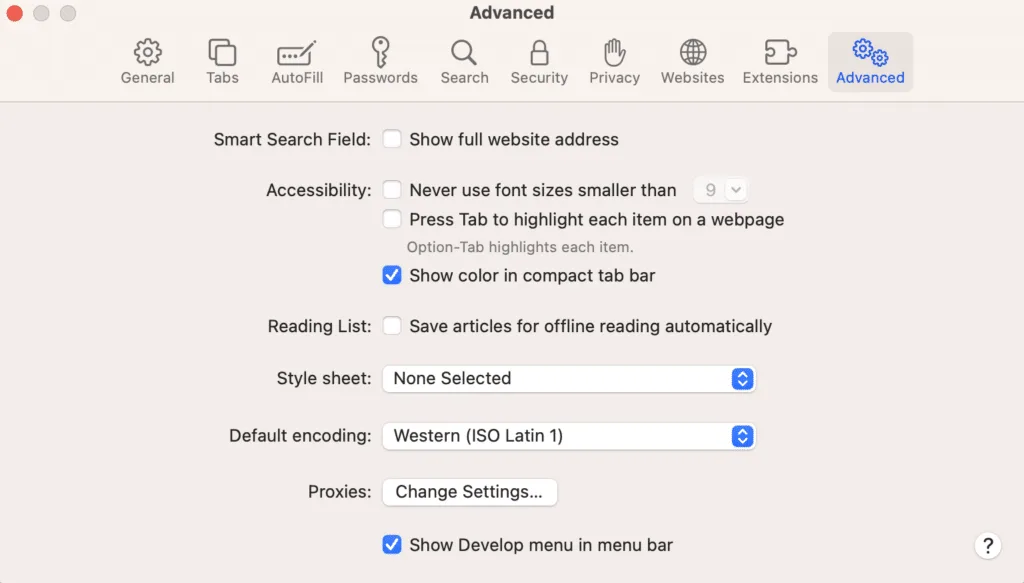
3. Setting up Web Inspector on Mac:
- Initiate Safari: Open Safari on your Mac. Ensure you’re using Safari and not another browser.
- Access Preferences: Navigate to
Safari->Preferences->Advanced. - Enable Develop Menu: Check the box labeled “Show Develop menu in menu bar.”
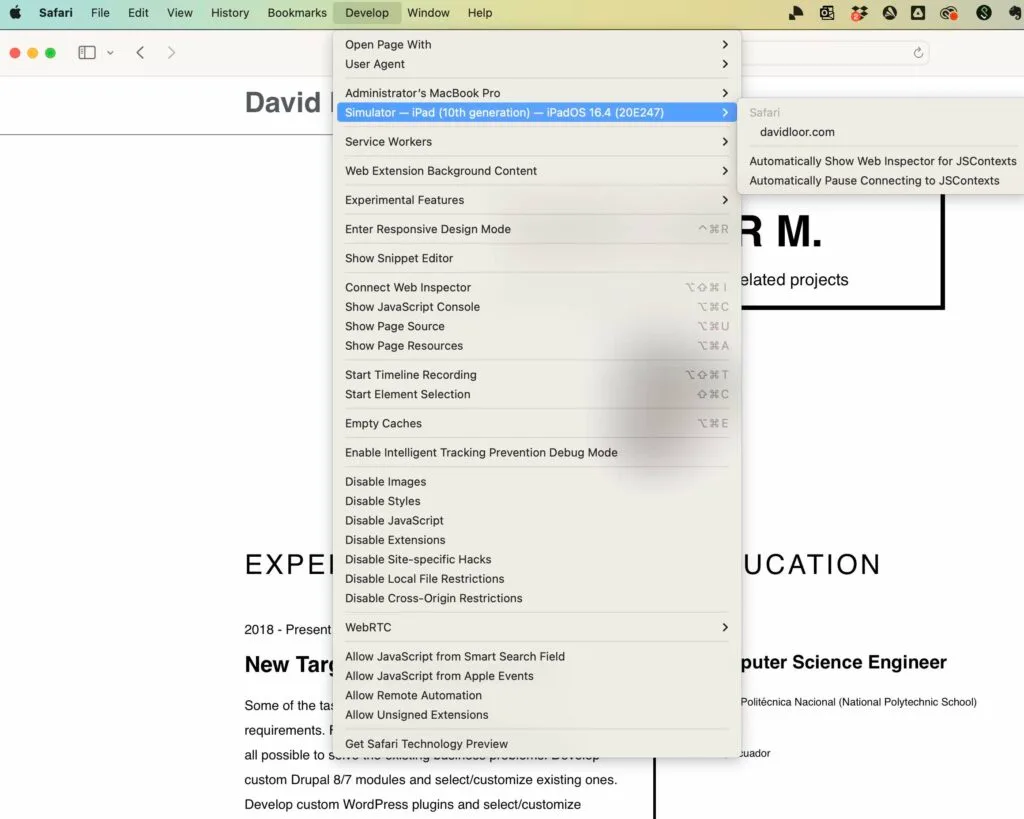
- Access Webpages: In Safari’s menu bar, click on
Develop. Under this, you’ll see your simulator or connected device listed. Hovering over the device’s name will display a list of open webpages. Click on the page you’d like to inspect.
4. Dive into Debugging:
- The Web Inspector, quite similar to developer tools in other browsers, allows you to inspect elements, check console logs, monitor network activity, and more.
- Replicate your issue in Safari (either on the simulator or device) and utilize the Web Inspector to gather insights and debug.

5. Key Features of Web Inspector:
- Console Logs: Vital for capturing errors or important logs.
- Network Requests: Monitor requests to ensure all assets load correctly and to track any API issues.
In Conclusion:
Debugging can sometimes be a daunting task, especially when the issue is platform-specific. However, with the right tools and a systematic approach, you can effectively identify and resolve problems in Safari on iOS. Always ensure you’re using the latest versions of Xcode and Safari, as updates often contain crucial bug fixes and improvements.
Happy debugging!