How to step debug PHP code with Xdebug and PhpStorm on a DDEV setup
What is debugging?
Per wikipedia: “In computer programming and software development, debugging is the process of finding and resolving bugs (defects or problems that prevent correct operation) within computer programs, software, or systems.”
Per Internet: “Debugging is like being the detective in a crime movie where you are also the murderer.” – Filipe Fortes
What is DDEV?
DDEV is an open source tool that allows setting up local sites quickly using docker. And, you don’t need to know much about docker to be able to use it, you just need to have it installed. A list of commands to get DDEV, and a WordPress or Drupal project up and running are available at ttps://davidloor.com/2021/12/22/how-to-setup-a-wordpress-and-drupal-local-site-with-ddev/
What is Xdebug?
Xdebug, per the official website, “is an extension for PHP, and provides a range of features to improve the PHP development experience”.
One of the features that Xdebug provides is step debugging, where Xdebug interacts with an IDE using the DBGp protocol. PhpStorm, Sublime, Netbeans, Visual Studio Code and others well known IDEs support it. With step debugging, programmers are able to set break points in any line of a PHP script, where they want to stop its execution to be able to see the the program state and behavior at that specific point.
Why should we bother about using a tool like xDebug when we have functions error_log, print_r, var_dump and other similar ones that we all have used a lot? Because xDebug will make you a much faster coder and bug fixer.
Let’s suppose that you need to debug a php file, where you are almost sure that there is a bug, base on the server error logs, just using functions like error_log, print_r. You will need to start calling these functions, passing the variables that you want to output, and refresh the page in the browser to check the output, and if the variables don’t give you the information that you need to fix the problem, you will need to repeat the process with a different set of variables until you get the information that may be helpful to fix the bug. And, as we know, that process is time consuming.
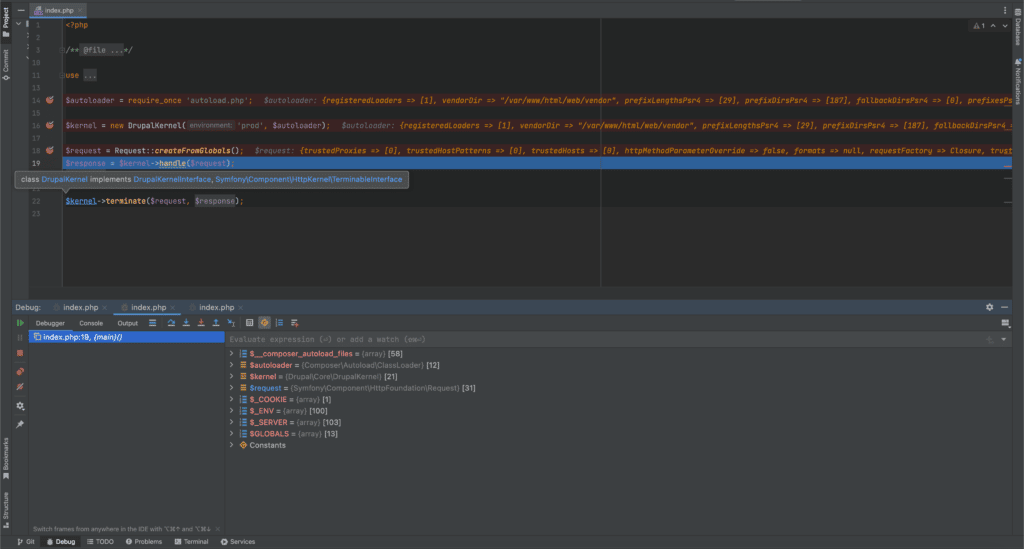
To debug the same hypothetical bug from above, in a PHP script, using xdebug, you will need to set the breakpoint in the line(s) where you want to see state of the program, and refresh the browser. You will be able to see all the variables in scope during the request, as you can see in the following screenshot, in just one interaction.

Install and enable xDebug
- Xdebug is already installed when using DDEV.
- To enable Xdebug on the DDEV project, in the terminal, just run ddev xdebug on
- you should get Enabled xdebug as output
Start listening for PHP debugging connections in PhpStorm
- Open your PHP project in PhpStorm
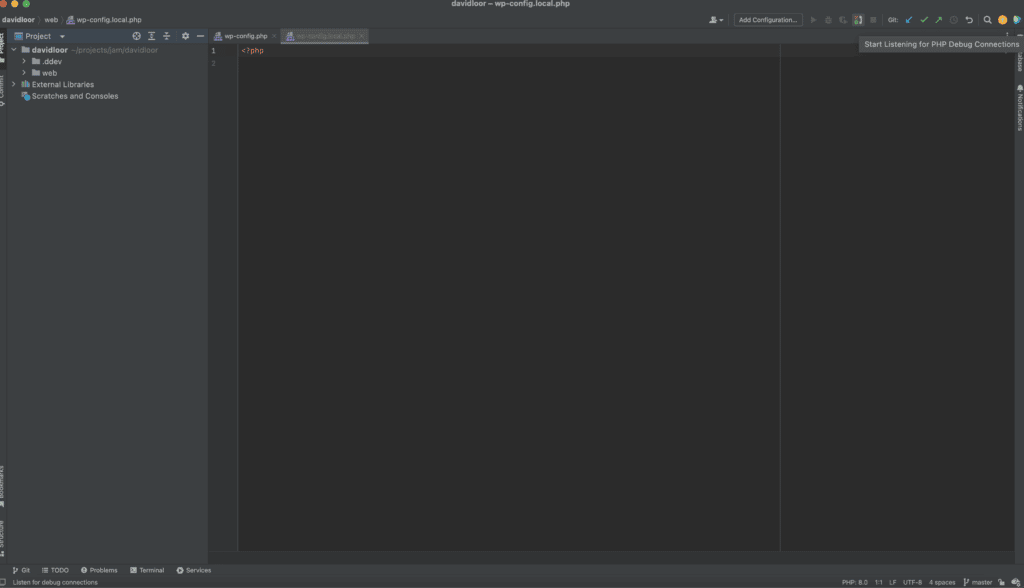
- In the right top corner of PhpStorm, you will find a small telephone button, click on it to start listening for php debugging connections.

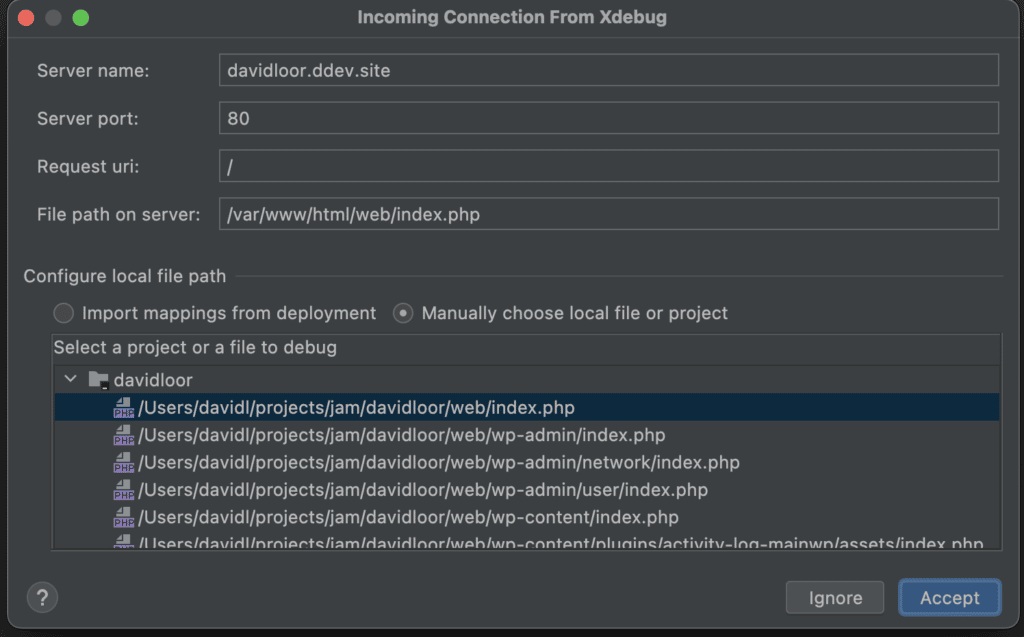
- Open your local site in a browser, and in PhpStorm you will be prompted to accept the incoming connection from Xdebug, where you should click Accept.

Final thoughts
Xdebug is just another tool that can be used to find and resolve bugs in PHP code. It can help to boost the productivity of a PHP developer in many cases.
PhpStorm is also another tool, which has great features for PHP development. I started using it 2 years ago after hearing all the benefits that provided to my coworkers. For more than 13 years, I was be a big fan of Apache Netbeans, which works great with Xdebug too, but some additional steps were needed to have it fully working though, and it used to use too many resources from my computer which became super slow.
We should remember that, “You’re only as good as the tools you use.”